Computer vision and data visualization.
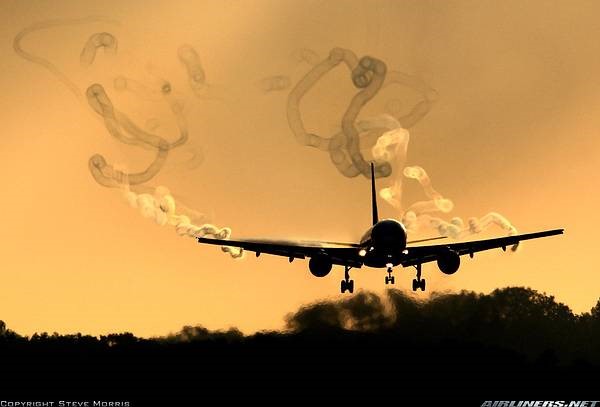
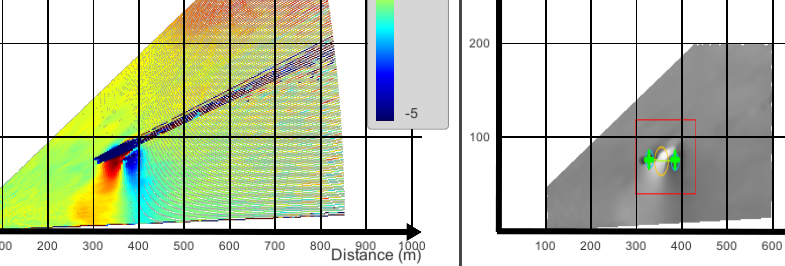
A wake vortex is a complex disturbance caused by flying aircrafts. It’s a pair of vortices that trail from the tips of the wings. This could be dangerous for landing or take off, and has to be carefully anticipated. Eurocontrol’s team worked for years to establish how long pilot have to wait between two landing to prevent airplanes from crashing at these critical stages.
Detecting shape and pattern with computer vision
Although wake vortice had been well studied in wind tunnel, and modeled by mathematical formulas. The detection in the real world remains a hard challenge. Not only because measuring the velocity of particles floating in the air at 400 m while a A380 is landing is tricky. But also because there is no existing software to compute theses highly noised data in real time.
Octarina has created a specific computer vision tool for Eurocontrol. It can detect, wake vortexe, characterizes and tracks them over times via Lidar data. And thus, it helps Eurocontrol’s researchers to optimize airplanes flow in European airports without compromising the passengers safety.
Existing methodology improvements
The selected approach is to compute each acquisition without using any mathematical assumption based on theoretical wake wortex formulas. In this way, we ensure that the result is fully based on data captured from the field, and do not rely on any mathematical function. This way, we do not introduce any kind of prediction in our observation results.
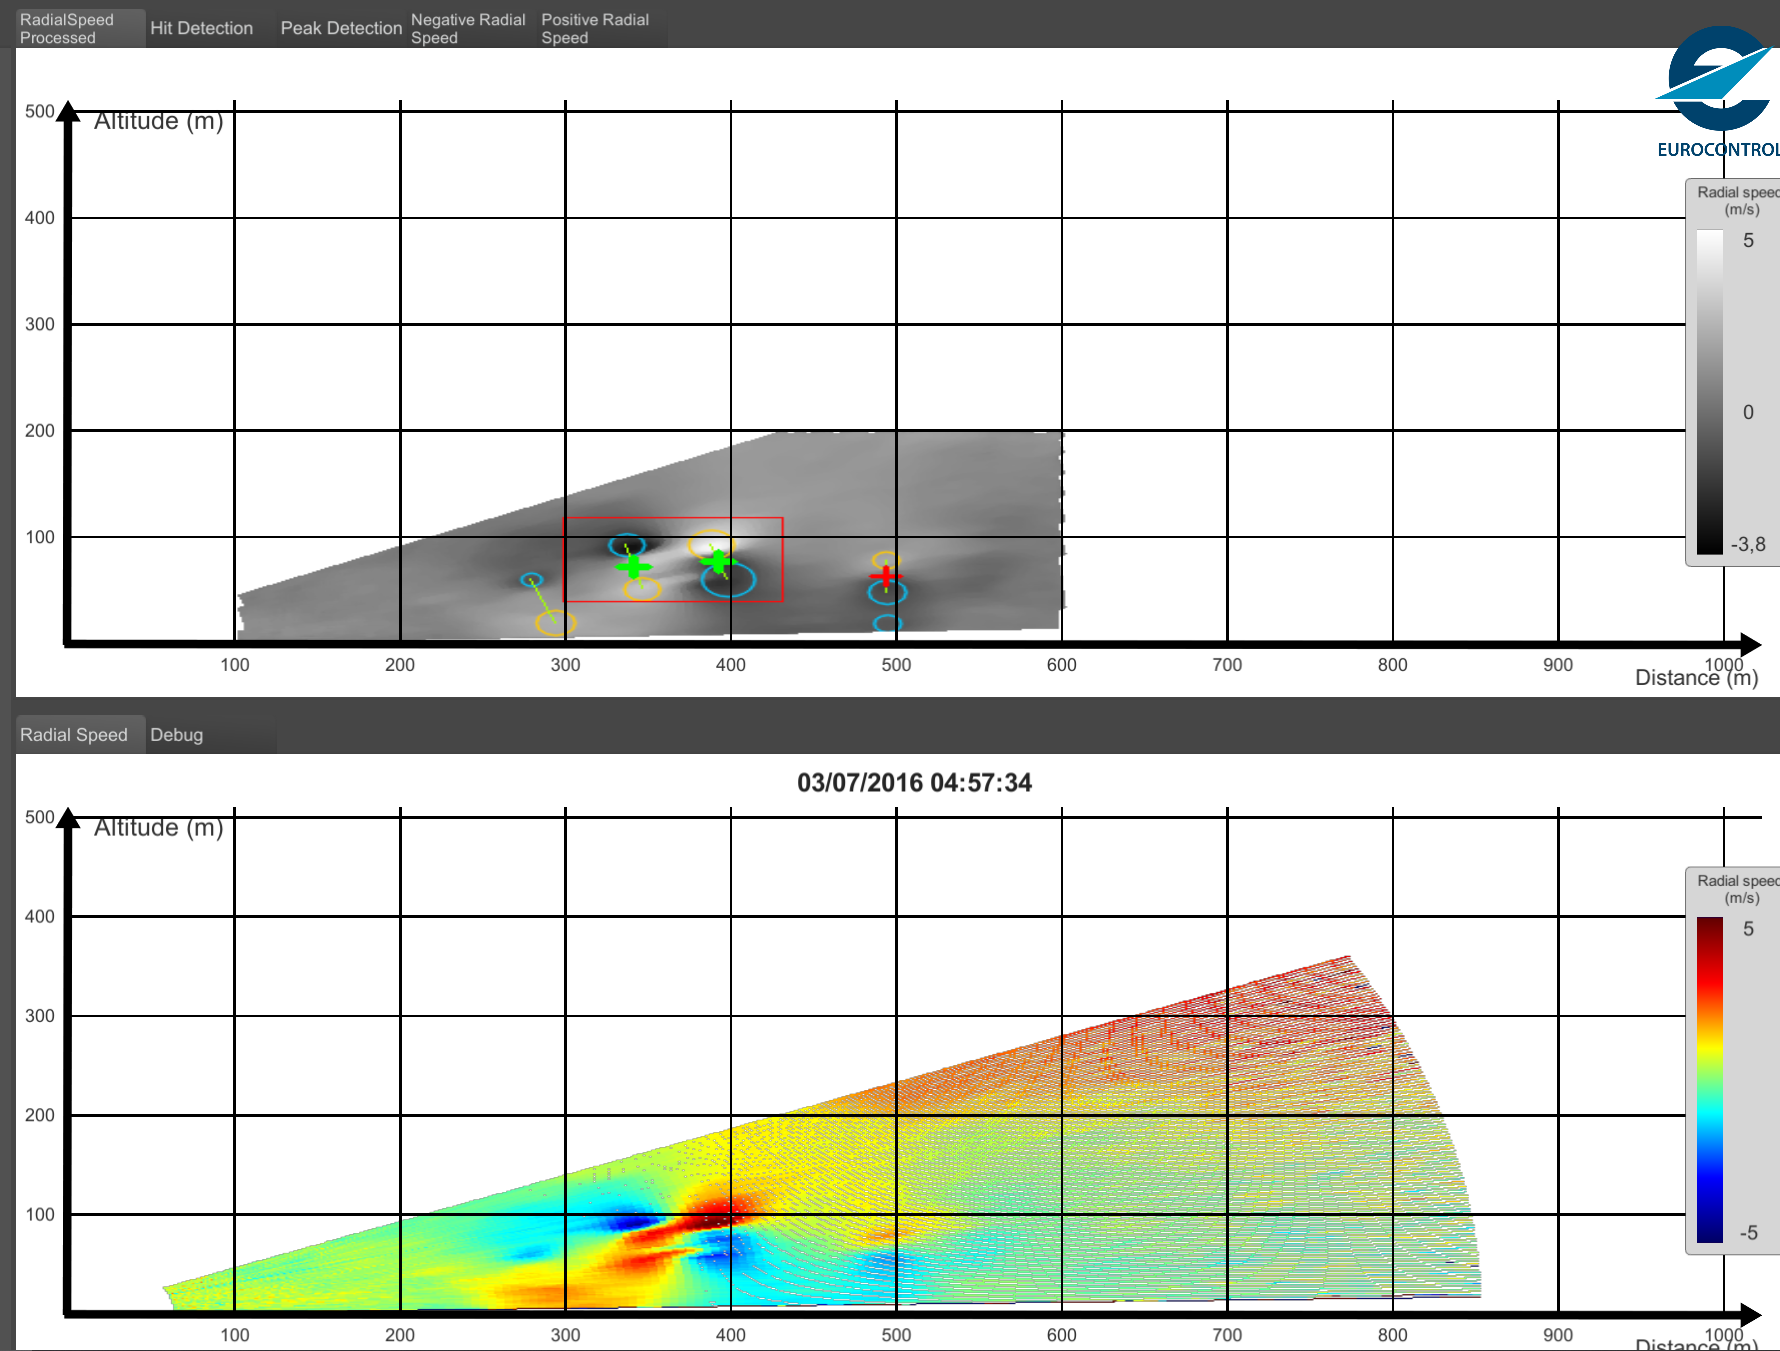
This is not the only improvement made on existing approaches. We also increase the ability of the software to remove high frequency noise, and “hit” – a hit happened when the Lidar’s ray collides with the airplane. The result is an important wrong data values on a part of the acquisition.
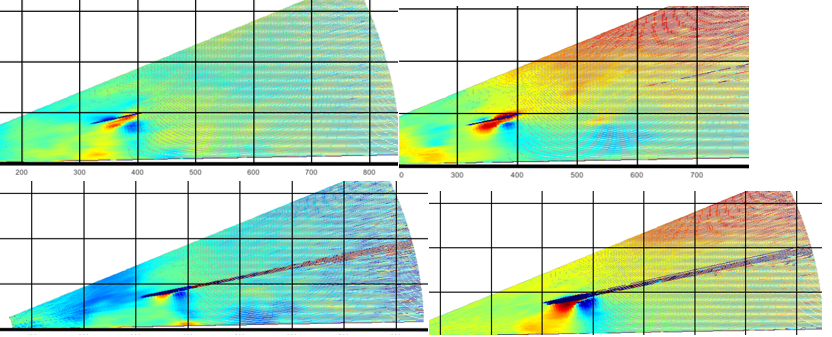
Our software is able to detect these hits based on the wind intensity gradient. We can extract theses areas and fill them using neighborhood information. And then, we can correctly identify the wake vortice and associated information.
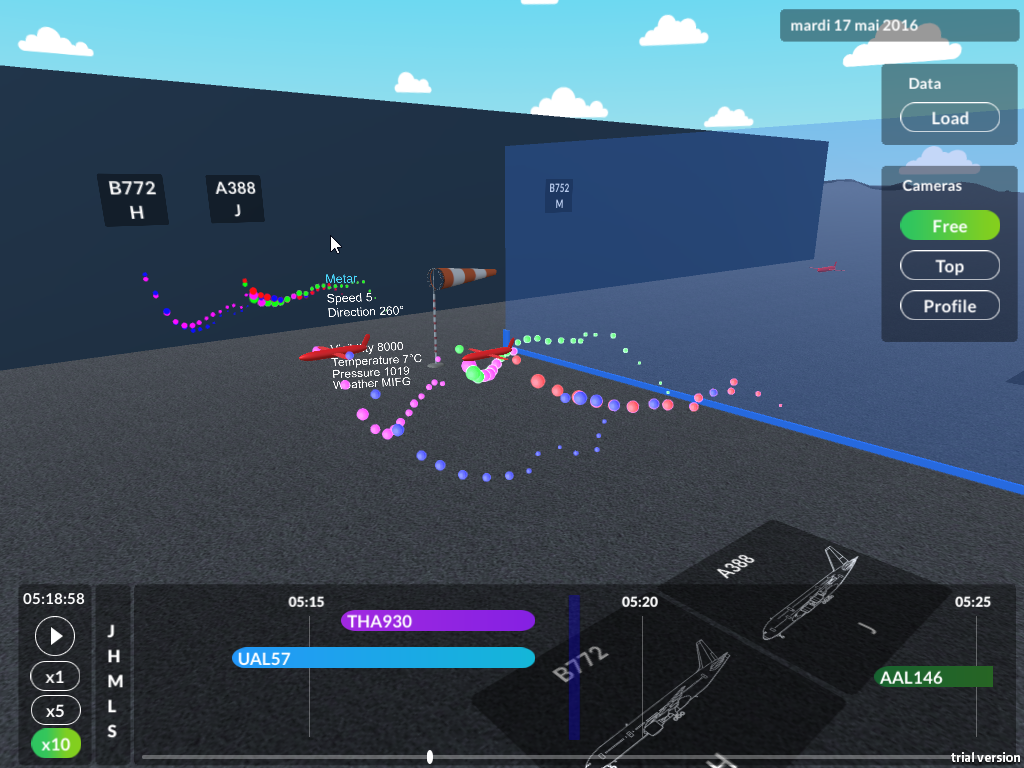
Data visualization
The next challenging step is about data visualization: how to display this information and let final users see and interact with those complex data. The module allows to play full landing/take off sequences including 3D real time visualization of wake vortex, timeline, wind direction, aircraft categories,…